How popularity rank in CrUX works and when to trust a change in it
 Marko Fedorenko
The Chrome UX Report has a field called experimental.popularity.rank. It shows how popular a site is among Chrome users in a given country. I had long wanted to know how far this field can be trusted. So I exported it for four countries over three months and counted what happens there.
That gave me 12 files and 17,023,265 rows: Ukraine, Germany, France and the US, July–September 2026. Below I explain how rank is calculated, why it changes and how to tell a real change from a random one. All the charts, with country and period filters, are in a separate interactive dashboard.
What is popularity rank and how does Google calculate it?
Popularity rank is the group an origin falls into by its number of navigations in Chrome. An origin is a scheme plus a host, so https://www.example.com and https://m.example.com are counted separately. Google sorts all origins in a country by navigations and splits them into groups. It does not publish the exact position inside a group.
The groups follow the scale 1,000, 5,000, 10,000, 50,000 and so on. Each group excludes the previous one. So the group with rank 5000 holds 4,000 origins, not 5,000. I checked this on all 12 files, and the sizes matched exactly.
| Rank | Positions in the country ranking | Origins in the group |
|---|---|---|
| 1000 | 1–1,000 | 1,000 |
| 5000 | 1,001–5,000 | 4,000 |
| 10000 | 5,001–10,000 | 5,000 |
| 50000 | 10,001–50,000 | 40,000 |
| 100000 | 50,001–100,000 | 50,000 |
| 500000 | 100,001–500,000 | 400,000 |
| 1000000 | 500,001–1,000,000 | 500,000 |
| 5000000 | from 1,000,001 | the remainder |
The last group in a country is always incomplete, because it takes whatever is left. The Ukrainian dataset has about 260,000 origins, so its last group is 500000. In France it is 1000000, in Germany and the US 5000000. The same rank in two countries means a different share of the market.
Three points from the documentation are worth keeping in mind. The data comes only from Chrome on desktop and Android, without iOS. Only sites that are open to indexing and have enough visitors get into the dataset. And Google adds a small amount of randomness, so nobody can reconstruct real traffic.
Why can rank drop when traffic has not changed?
Rank can drop because the number of places in each group is fixed. When one origin enters the top 1,000, another has to leave. I counted this for three thresholds and three periods in each country. The number of origins that entered always equalled the number that left.
So rank shows your place relative to other sites in the country. If everyone around you grew and you stayed flat, your rank gets worse. If everyone fell, you included, rank may not change at all. You cannot learn traffic volume from this field.
A sizeable share of origins changes group each month: from 12% in the US to 27% in Germany. A change in rank alone therefore tells you little. Below I go through the four reasons behind it.
What moves rank?
I found four reasons: being close to a group boundary, the season, a site changing its address and the dataset threshold. They look the same in the table but call for different reactions. I checked each one against the data.
The site sits near a group boundary
An origin in position 4,990 and one in position 5,010 have almost the same traffic. Yet the first has rank 5000 and the second 10000. A small fluctuation is enough for them to swap. These moves are the most common ones.
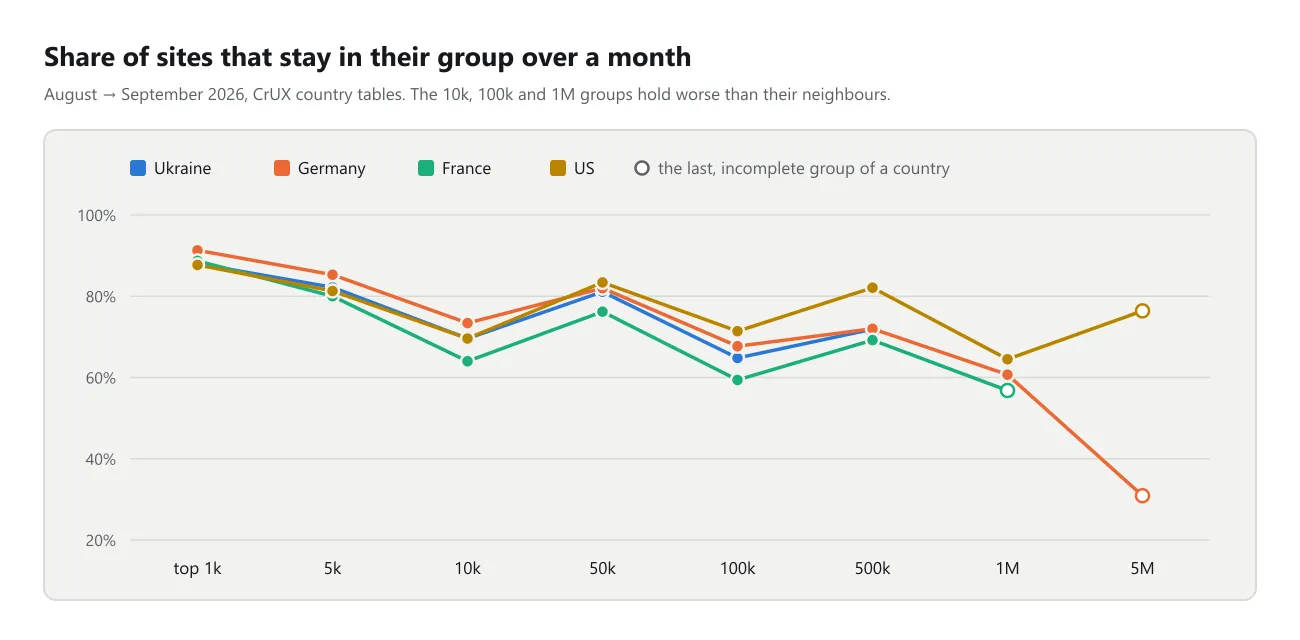
The chart has a sawtooth shape. The 5k, 50k and 500k groups keep 69–85% of their members over a month, while the 10k, 100k and 1M groups keep only 59–73%. This fits the way the scale is built. The 10k group covers positions 5,001 to 10,000, a twofold gap between its edges. In the 5k group the gap is fivefold, so the boundary is further away on average.
Next I counted the origins that changed group in August and came back in September. The table shows their share in each group.
| Country | top 1k | 5k | 10k | 50k | 100k | 500k | 1M |
|---|---|---|---|---|---|---|---|
| Ukraine | 0.9% | 2.7% | 6.3% | 3.7% | 9.2% | — | — |
| Germany | 2.5% | 2.8% | 6.1% | 3.7% | 7.4% | 7.7% | 14.2% |
| France | 2.1% | 3.8% | 8.1% | 4.4% | 9.2% | 8.4% | — |
| US | 0.6% | 1.7% | 3.4% | 2.5% | 5.1% | 3.8% | 9.7% |
I left the last, incomplete group of each country out of the table. In the 10k, 100k and 1M groups up to 14% of origins go back and forth. If your site is in one of them, a single change in rank means little.
The season lifts one category and pushes the others down
I tagged origins by words in the hostname. Hosts with words like edu, school, univ and moodle went into education. The filter is rough and misses some sites, but it shows the direction clearly.
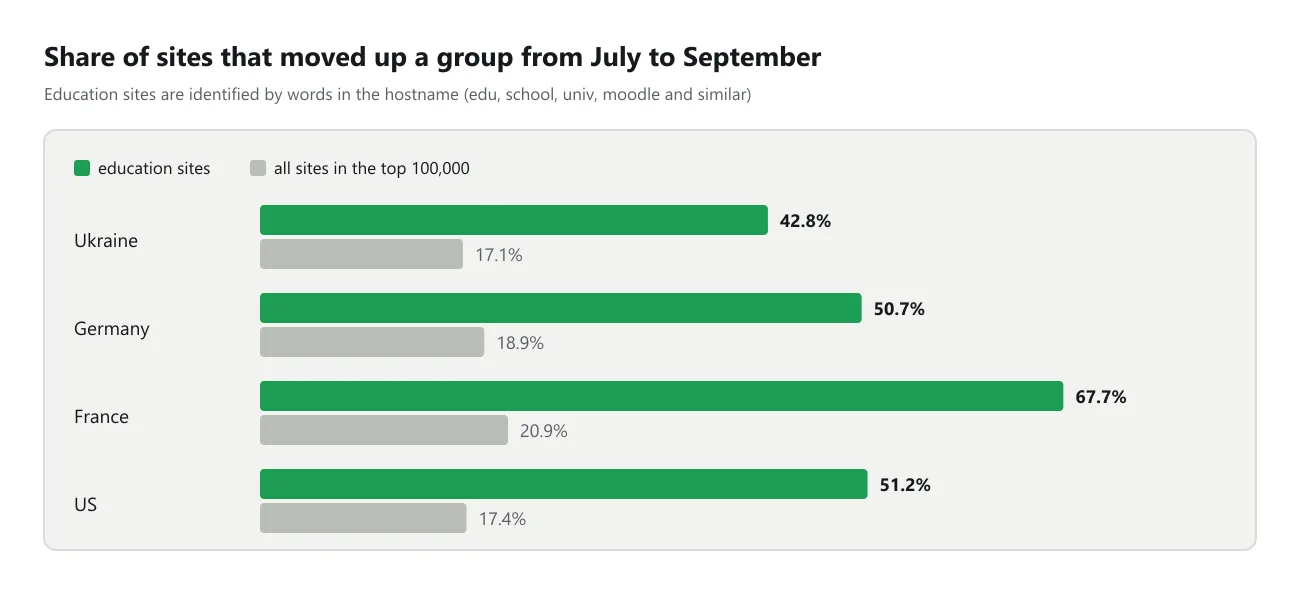
From July to September education origins moved up about three times as often as the rest. The timing differs by country. In the US the jump came in August, in France in September. In Ukraine and Germany it lasted both months.
Travel sites moved the other way. In France 56% of them dropped from August to September, against 21% of all origins. Here I looked for words like booking, hotel, travel and camping.
The more interesting part is what follows. Places in a group are fixed, so one category moving up pushes the rest out. The US top 10,000 had 218 education origins in July and 654 in September. Those 436 places are a fifth of all replacements in the top 10,000 over two months. A site with a steady audience could lose its group in September for this reason alone.
The service changed its address
Rank is tied to the exact address. When a service moves to a new domain, the old address drops and the new one appears from nowhere. In the table this looks like two big changes, though the audience is the same.
I looked for “families”: the same name on three or more different domains in a country’s top 10,000. The table shows how many there are and what share of new top-1,000 entrants they gave from July to September.
| Country | Families | Domains in them | New in top 1,000 | From families |
|---|---|---|---|---|
| Ukraine | 102 | 449 | 156 | 33 (21%) |
| Germany | 58 | 260 | 125 | 6 (5%) |
| France | 64 | 283 | 148 | 11 (7%) |
| US | 20 | 82 | 209 | 3 (1%) |
Ukraine stands apart here. A fifth of the turnover in its top 1,000 comes from services that run on several domains at once. Judging by the names, these are mostly movie and betting sites, and one name appears on 19 domains. For any analysis of the Ukrainian market such origins need to be grouped into one brand.
Note that families also include ordinary international brands with a domain per country. In the US and Germany the family with the most domains is amazon.
The site crossed the dataset threshold
Each month some origins appear in the table and some disappear. There can be two reasons. The number of visitors crossed a threshold Google does not disclose, or access to indexing changed.
These moves are the least stable of all. About half of the origins that first appeared in August were gone in September: from 47% in the US to 52% in Germany. Of those that disappeared in August, 17–26% returned in September. A site missing from the table for one month has not necessarily shut down.
How do you tell a real change in rank from a random one?
Three signs point to a real change: a large jump, a repeat the following month and the same move in another country. I checked each one against the data. All three clearly raise the odds that a change holds.
The first sign is the size of the jump. I took all group changes from July to August and looked at what share was fully reversed in September.
| Country | Up 1 group | Up 2+ | Down 1 group | Down 2+ |
|---|---|---|---|---|
| Ukraine | 41.6% | 13.9% | 25.4% | 7.7% |
| Germany | 34.8% | 9.4% | 36.6% | 17.8% |
| France | 46.1% | 15.4% | 33.5% | 5.2% |
| US | 44.0% | 11.6% | 23.5% | 5.7% |
A rise of one group is reversed in 35–46% of cases, a jump of two or more in 9–15%. Large jumps are rare: from 1.6% of all changes in France to 6.1% in the US. In Ukraine, France and the US a rise deserves less trust than a fall.
The second sign is two months of movement in the same direction. That happened to fewer than 1% of origins: from 0.43% in France to 0.82% in Germany. If your site moved the same way twice in a row, that is a rare event and worth a closer look.
The third sign is other countries. I took origins that changed group in two countries at once between July and September. In 79–83% of cases the direction matched, where random movement would give about 50%. If a site is present in several countries, compare the change with the neighbouring table.
Why are an origin and a site different things?
An origin is one address, while a site can consist of dozens of them. Large services keep different products on different subdomains, and each subdomain takes its own place in the ranking. I grouped origins by registrable domain and counted how many sites really stand behind the top 1,000.
| Country | Sites in the top 1,000 | Places held by domains with several origins |
|---|---|---|
| Ukraine | 887 | 180 |
| Germany | 891 | 170 |
| France | 859 | 210 |
| US | 826 | 241 |
The US top 1,000 holds only 826 sites. One education service, instructure.com, has 37 addresses there, and google.com has 29. In the Ukrainian top google.com has 20 addresses and rozetka.com.ua has 7.
For a site owner the takeaway is simple. Traffic spread across subdomains gives each of them a lower rank. Comparing your www with a competitor that keeps everything on one address is not a fair comparison. I wrote about the difference between origins and domains in my article on how many websites with traffic there are.
Can you compare rank between countries?
No, you cannot compare one site’s rank between countries directly. Each country table has its own ranking and its own size. Rank 10000 in Ukraine is the top 3.8% of the dataset, and in the US only 0.3%.
Country tops are mostly local. The table shows how many origins two countries shared in their top 1,000 in September.
| Country pair | Shared origins in the top 1,000 |
|---|---|
| Germany – France | 191 |
| Germany – US | 161 |
| France – US | 151 |
| Ukraine – Germany | 132 |
| Ukraine – US | 110 |
| Ukraine – France | 105 |
Only 91 origins are in the top 1,000 of all four countries, and 18 of them are google.com subdomains. Of the 1,000 most popular origins in France, 481 are not in the Ukrainian dataset at all. All four datasets share 69,259 origins, and only 13.5% of them have the same group everywhere.
Turnover differs too. Over two months the top 1,000 changed by 12.5% in Germany, 14.8% in France, 15.6% in Ukraine and 20.9% in the US. The US top moves the most, partly because of education: 41 education origins entered it.
How do you use rank in practice?
I boiled it all down to seven steps I follow myself when I look at the rank of my own site or a competitor. Each step rests on a number from the sections above.
- Collect every address of the site:
www,m, other subdomains and the old address if the site has moved. - Look at the size of the change. One group: wait for the next month. Two or more: the change holds in over 80% of cases.
- Take your group into account. In the 10k, 100k and 1M groups up to 14% of origins go back and forth.
- Remember the season. In August and September education sites take hundreds of places in the top.
- Compare with another country if the site is present there. The direction matches in 79–83% of cases.
- Do not read the last group as a position. It loses 16–39% of its origins each month.
- Compare sites only within one country table.
The dashboard has an explorer of origins from each country’s top 10,000. You can find your site there and see its group over three months.
If a change passes these checks, dig further with your own analytics. Rank tells you that something happened, but the cause and the volume have to come from other data.
Which queries let you check your own site?
You can check your site with two BigQuery queries. The first shows the rank of specific addresses over three months. Replace country_ua with the country you need and the addresses with your own.
SELECT _TABLE_SUFFIX AS yyyymm, origin,
       MIN(experimental.popularity.rank) AS rank
FROM `chrome-ux-report.country_ua.*`
WHERE _TABLE_SUFFIX BETWEEN '202607' AND '202609'
  AND origin IN ('https://example.ua', 'https://www.example.ua')
GROUP BY 1, 2
ORDER BY origin, yyyymm
The second query finds every origin of one site in the dataset. It helps with the first step in the list above.
SELECT DISTINCT origin, experimental.popularity.rank AS rank
FROM `chrome-ux-report.country_ua.202609`
WHERE NET.REG_DOMAIN(origin) = 'example.ua'
ORDER BY rank
For this article I made the exports with a simpler query: SELECT DISTINCT origin, experimental.popularity.rank from each monthly table. The two queries above use the same field, but test them on a small sample before relying on them.
What can this data not tell you?
This data cannot tell you the cause of a specific change or show a full year. I have three months and four countries, which is enough only for the mechanics. Here are the limits to keep in mind.
- Seasonality is visible only for July–September. I do not know how the same categories behave in winter.
- I defined categories by words in the hostname. The filter misses sites without such words and sometimes catches extra ones.
- I found the registrable domain with a simplified rule, without the full public suffix list.
- The link between the sawtooth and group width is a match with how the scale is built. I did not test it separately.
- Google marks the metric as experimental, so its rules may change.
These limits do not change the order of magnitude. But exact percentages for another period or country have to be counted again.
Sources
I took the description of the metric from the Chrome documentation and counted all the numbers on origin movement from my own exports. I read the documentation on 9 November 2026.
- Chrome for Developers, “CrUX Metrics”, Popularity section. https://developer.chrome.com/docs/crux/methodology/metrics
- Chrome for Developers, “Adding Rank Magnitude to the CrUX Report in BigQuery”. https://developer.chrome.com/blog/crux-rank-magnitude
- Chrome for Developers, “CrUX methodology”: who and what gets into the dataset. https://developer.chrome.com/docs/crux/methodology
- Chrome UX Report in BigQuery: tables
country_ua,country_de,country_fr,country_usfor 202607–202609. CrUX data is licensed under CC BY 4.0.
If you run these queries on your site and see something odd, write to me. I would like to collect more examples, especially from other countries.
See more from marko-f.com in your Google Search results.